
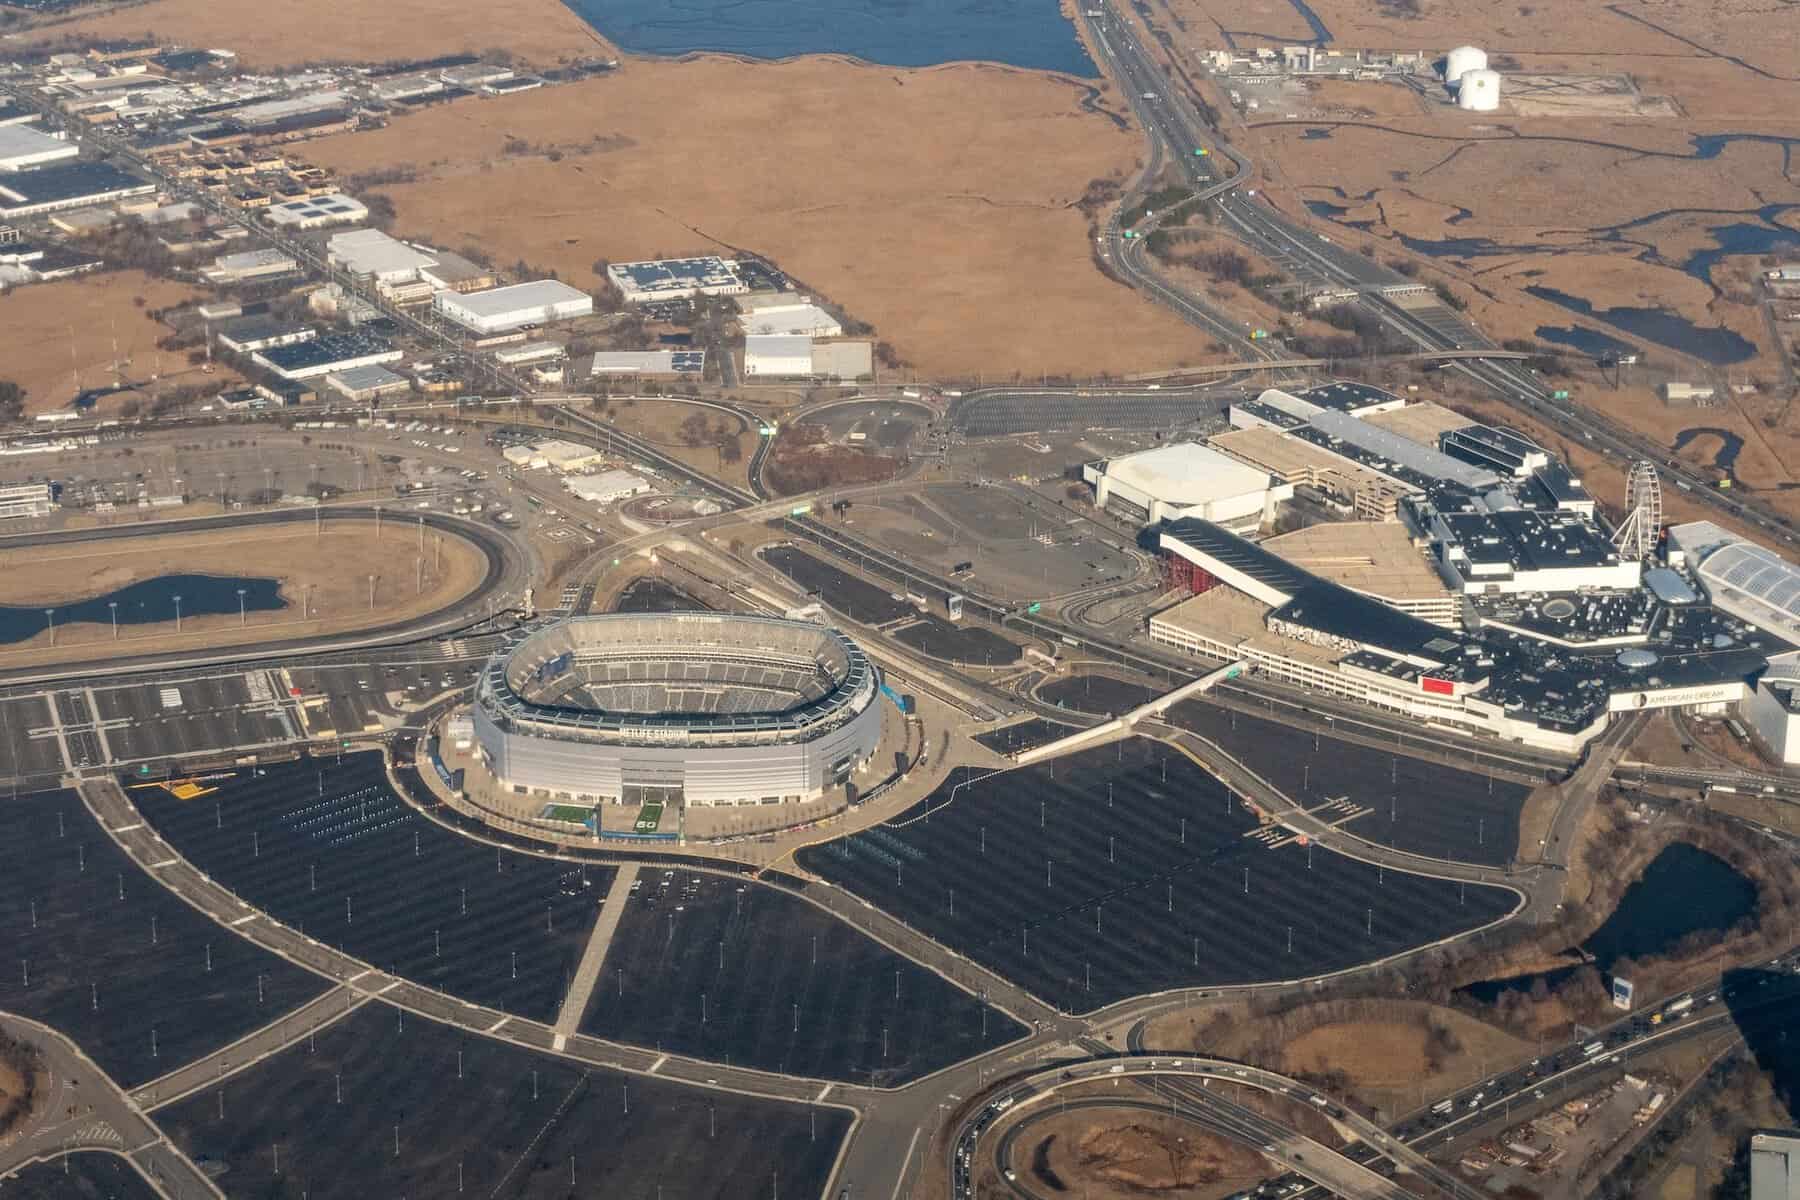
CATALYST used multispectral satellite data to monitor FIFA World Cup 2026 pitch conversions and highlight the potential use of Earth Observation for asset management.
A World Cup pitch is one of the most scrutinized surfaces on Earth, watched in real time by billions of people. The millimetre level of inspection the grounds must go through to be playable, presents an unusual proving ground for satellite data. If satellite data can detect change on a surface this visible, the same analysis holds true for assets that are genuinely hard to monitor such as a farming operation spanning thousands of hectares, a government agency tracking land use and vegetation compliance across an entire region, or a utility company managing vegetation encroachment along hundreds of miles of transmission corridor.
Several FIFA World Cup 2026 venues are NFL stadiums built for synthetic turf. To meet FIFA's real-grass mandate, those surfaces had to undergo extensive reconstruction in a matter of weeks. An entire pitch replacement happened invisibly behind the broadcast. Billions of viewers watching from home saw only the finished result: lush, green, tournament-ready football pitches. Satellite data captured everything the camera couldn’t.
NDVI and Vegetation Health
Using CATALYST's INSIGHTS platform, we processed Sentinel-2 multispectral imagery to track the full conversion process at Lumen Field in Seattle, home of the Seattle Seahawks, from September 2025 through June 2026. What we found demonstrates exactly why spectral data analysed over time is so much more powerful than what the eye, or a television broadcast, can capture.
What is NDVI and how is it calculated?
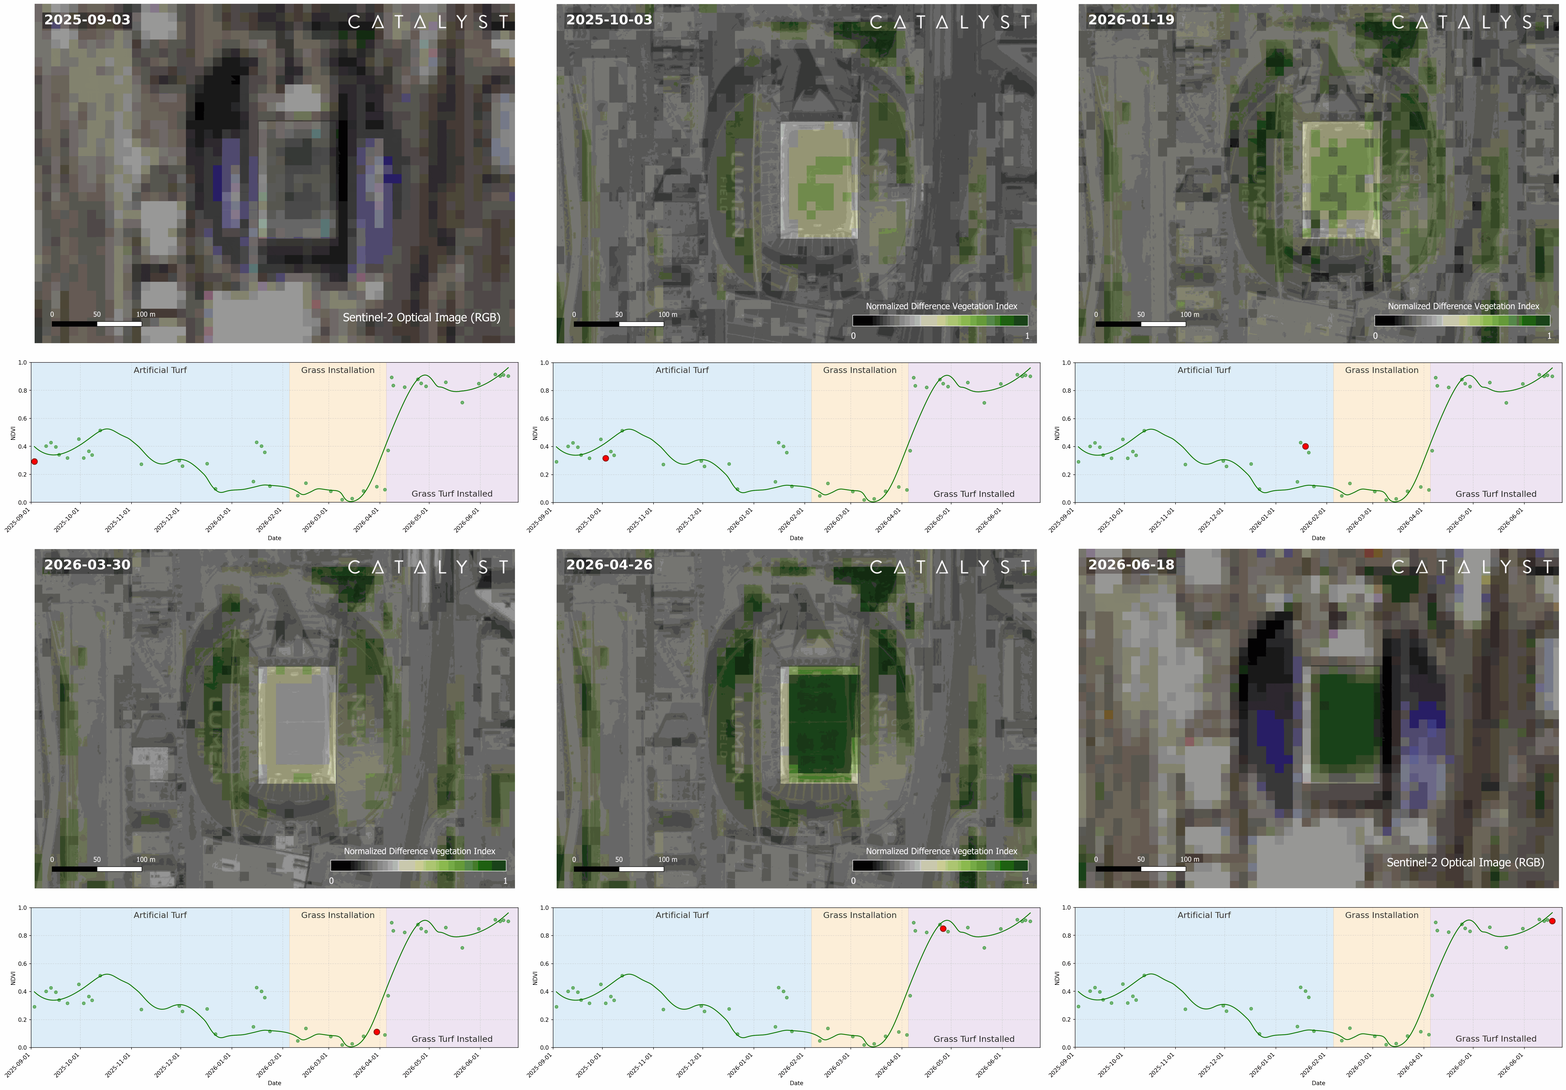
NDVI, the Normalised Difference Vegetation Index, ranges from -1 to 1. Bare soil and barren ground typically read 0.1 to 0.2, sparse or stressed vegetation reads 0.2 to 0.5, and dense, healthy vegetation reads above 0.5, with mature forest canopy often in the 0.6 to 0.8 range. At Lumen Field, CATALYST recorded NDVI as low as 0.02 during the bare-substrate installation phase and as high as 0.90 once natural grass was established.
The Normalised Difference Vegetation Index (NDVI) is a simple but powerful ratio of red and near-infrared reflectance. Chlorophyll in real grass absorbs red light strongly and reflects near-infrared (NIR) intensely, producing high NDVI values. However, synthetic turf lacks chlorophyll and therefore produces lower NDVI values.
Time-series analysis at Lumen Field, shown in Figure 1, captures the full arc of conversion. In autumn 2025, the artificial NFL pitch returned low-to-moderate NDVI, lush green on television, but spectrally unconvincing. As the installation process began in late February and March 2026, NDVI values collapsed toward zero. The installation phase involves laying sand and substrate over the existing surface, creating an essentially barren spectral signature. Then, from mid-April 2026 onwards, the signal rises sharply as natural grass is installed, reaching high NDVI values characteristic of healthy vegetation before the World Cup kicked off.
Can satellite data track vegetation change over time?
Yes, and revisit frequency sets the limit on how temporally fine-grained that tracking can be, assuming no cloud cover Satellite coverage from the Sentinel-2's constellation revisits most locations every five days, fine for a multi-month process like a pitch conversion but too slow for anything that changes faster. High-resolution commercial satellite constellations can revisit the same location several times a day, which is what makes near-real-time tracking possible once the change in interest moves faster than a five-day window can catch.
This is the same time-series engine behind CATALYST INSIGHTS: NDVI analysis applied to detect changes invisible to the naked eye, which is run automatically over time shows not just that something changed, but when, and whether that change reversed, fluctuated, or became permanent. It's a technique CATALYST applies well beyond football pitches, to any portfolio where surface or vegetation condition needs monitoring over time.
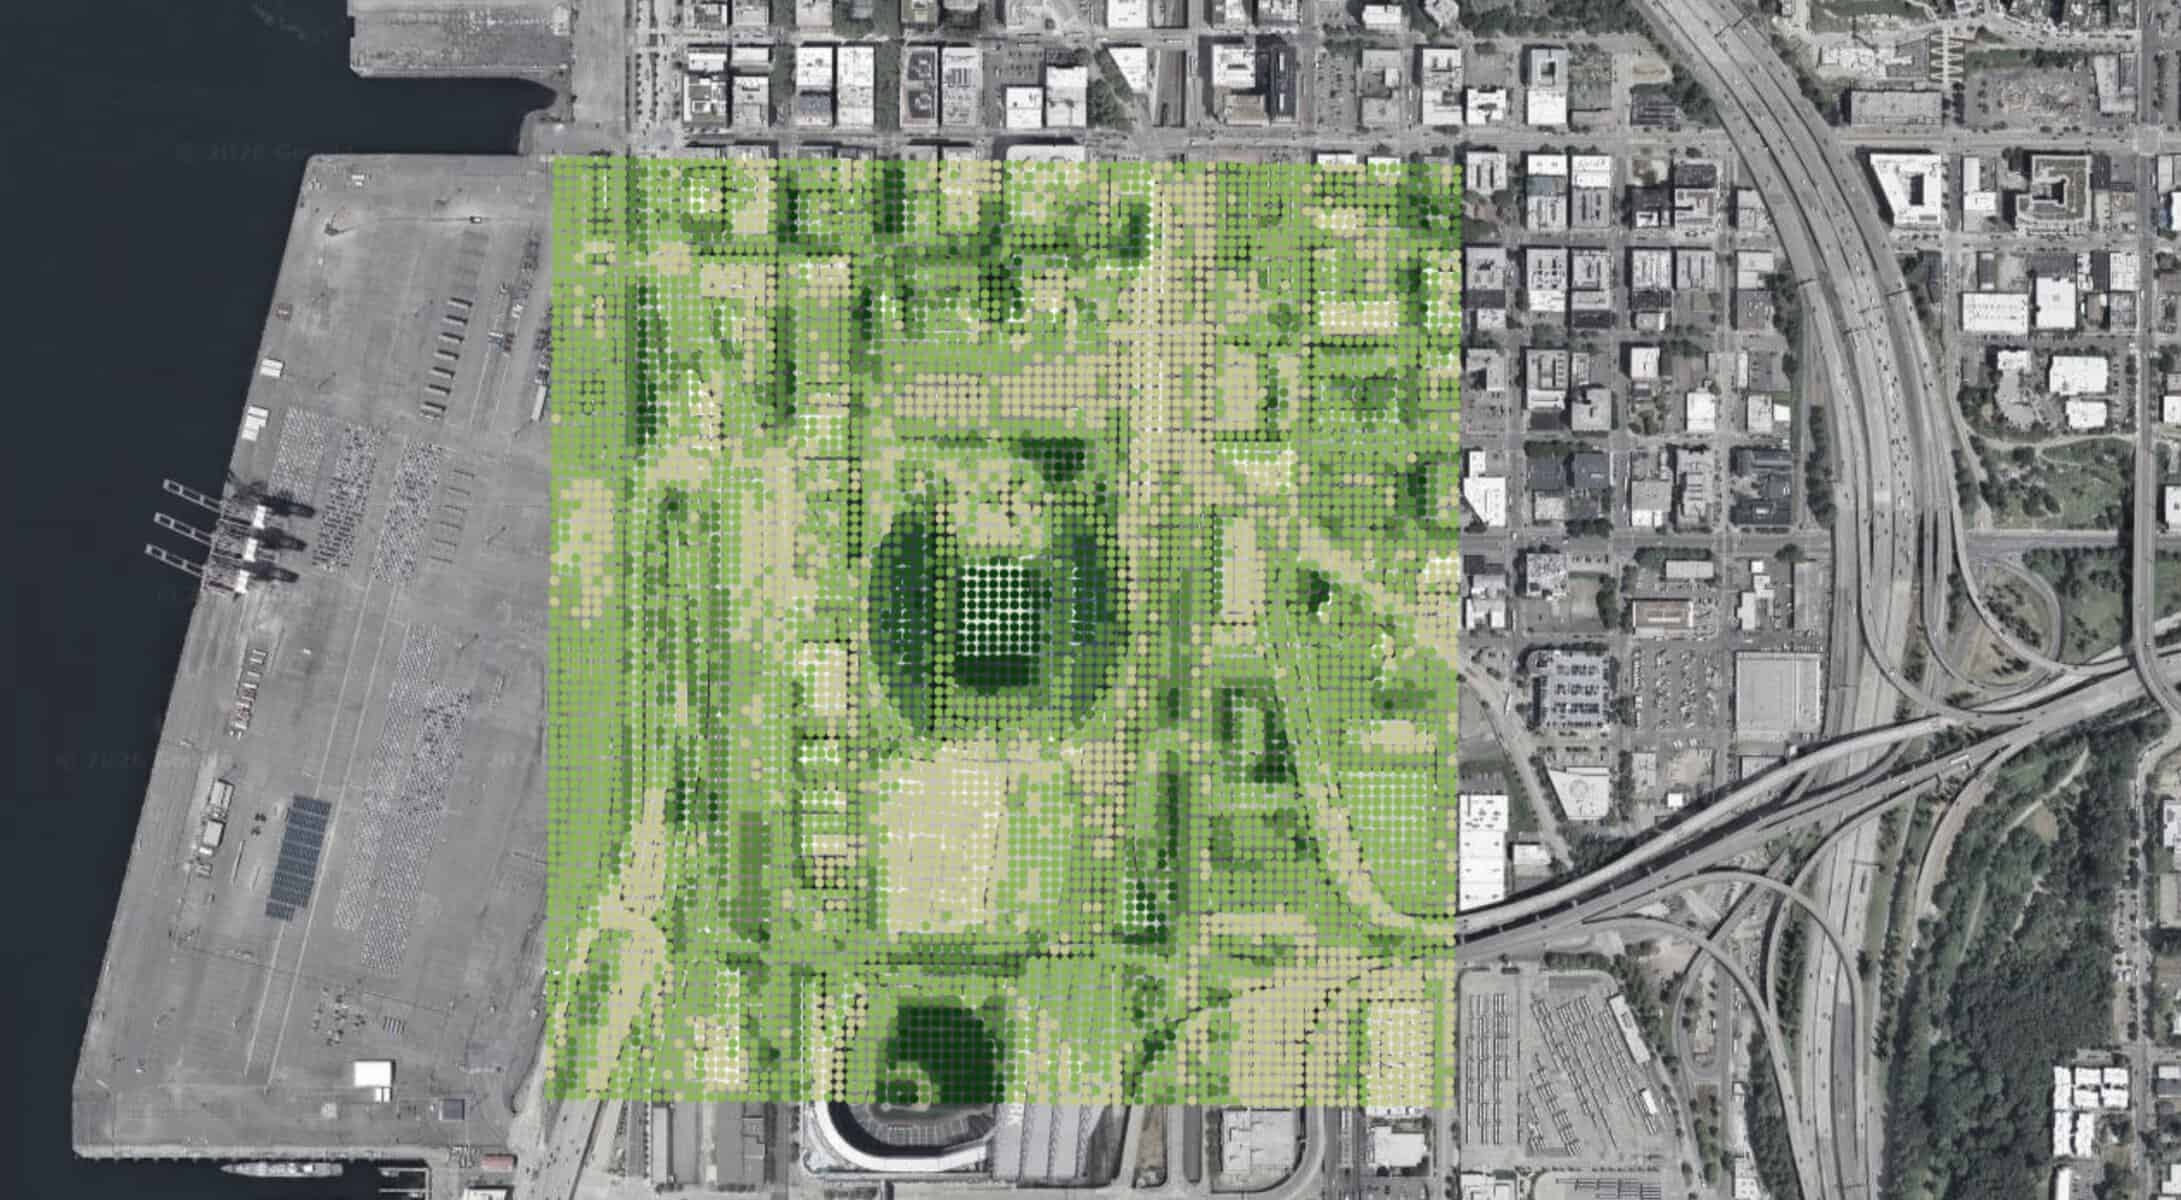
CATALYST INSIGHTS demo at Lumen Field
Pitch-Level Intelligence at Estadio El Campín, Bogotá
Colombia is the third-ranked South American team at the World Cup, behind Brazil and Argentina. Yet back home, one of the country’s largest football stadium, Estadio El Campín in Bogotá, has faced scrutiny over pitch quality in recent months.
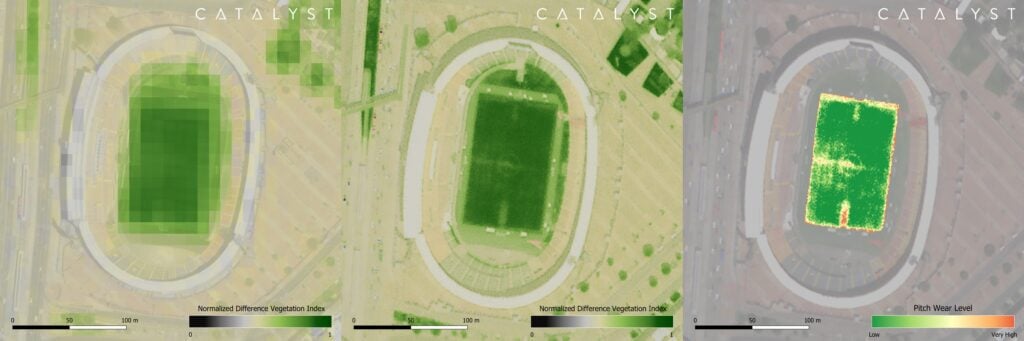
CATALYST processed Sentinel-2 NDVI data over Estadio El Campín from February 2026, shown in Figure 2. At 10m resolution, the pitch presents as a strong, largely uniform green signal consistent with healthy natural grass. That's a reliable answer for regional-scale monitoring. For anyone deciding where to allocate a limited maintenance or inspection budget, whether across a stadium, a farm, or a forestry concession, it's the wrong resolution to trust. In the case of the Estadio El Campín, high resolution data is considerably more applicable given the scale of the asset and the objective of assessing pitch quality.
How does satellite resolution affect vegetation monitoring accuracy?
Resolution determines how much ground a single pixel represents, and how much detail gets averaged away. One Sentinel-2 pixel covers about 100 square meters, roughly half a tennis court, blending everything inside that area into a single value. A high-resolution commercial pixel at around 0.9 meters covers well under a square meter, over 120 times more detail per pixel, small enough to isolate a single bare patch instead of averaging it into the surrounding green.
CATALYST's software and analytics products take a sensor-agnostic approach, meaning results of consistent quality can be reliably generated regardless of the data input. Furthermore, CATALYST can advise on the best data source considering the project objectives, challenges and budget at hand.
Therefore, the venue was also processed using Satellogic imagery from their NewSat satellites, which have a significantly higher spatial resolution (~0.9 m) compared to Sentinel-2 (~10 m). The spatial detail over Estadio El Campín is dramatically sharper – rather than a uniform dark green signal, heterogeneity in NDVI emerges across the pitch surface.
How does high-resolution mapping pinpoint exactly where vegetation risk is concentrated?
High-resolution NDVI shows where vegetation is stressed or encroaching, but it does not inherently translate that into a risk level. CATALYST combines NDVI with change detection, canopy detail, and client-specific operational context and expertise to convert these signals into actionable risk tiers. These tiers are defined around what the client actually needs to manage, for example identifying which span of a transmission corridor has vegetation likely to encroach on conductors this season versus areas that remain lower priority, which sections of a rail or highway right-of-way require clearing first, or which specific blocks of a field are driving a broader stress signal.
A decision-ready wear map was generated, showing pitch wear from the high-resolution data. The results are immediately interpretable for any asset owner or groundskeeper. Elevated wear is evident in both penalty areas, concentrated around the goalmouths, as expected from high foot traffic and goalkeeper activity. A distinct wear signature is also visible running from the tunnel entrance onto the halfway line, and the centre spot shows a localised zone of stress consistent with kick-off.
To a groundsman standing on the pitch, none of this is a surprise. That's exactly the point: EO-derived insights match what ground-truth knowledge already tells an expert at pitch scale. A stadium is small enough to walk and know by eye. Most of the assets CATALYST monitors, working farmland, forestry concessions, compliance and land-management portfolios, are not. That agreement between EO and ground-truth at a scale you can verify is what makes the same analysis trustworthy at a scale no one can
The Broader Opportunity
The World Cup pitch conversion story is a clear illustration of what multispectral satellite data can offer beyond conventional monitoring. CATALYST's INSIGHTS platform can process large temporal layers of imagery to deliver vegetation intelligence across seasons or years, tracking establishment, identifying stress before it becomes visible, and providing actionable, quantified insights to asset owners.
In agriculture, this same approach flags irrigation stress or disease pressure across thousands of hectares before it's visible from the ground. In government, environmental and land agencies use it to track vegetation condition and land use across a jurisdiction for a fraction of the cost of routine site visits. Similarly, in vegetation management, utilities and infrastructure operators use it to monitor encroachment along transmission corridors, rail lines, and pipeline right-of-way, flagging risk before it requires an emergency crew. For forestry and land management more broadly, the data turns scattered, irregular site visits into a continuous, quantified record: the data needed is already being collected at scale by satellites passing overhead every few days.