Catalyst.earth Logo
Catalyst.earth Logo

Image Analytics and Processing

Image analysis tools that are deeply rooted in decades of remote sensing and earth observation sciences.

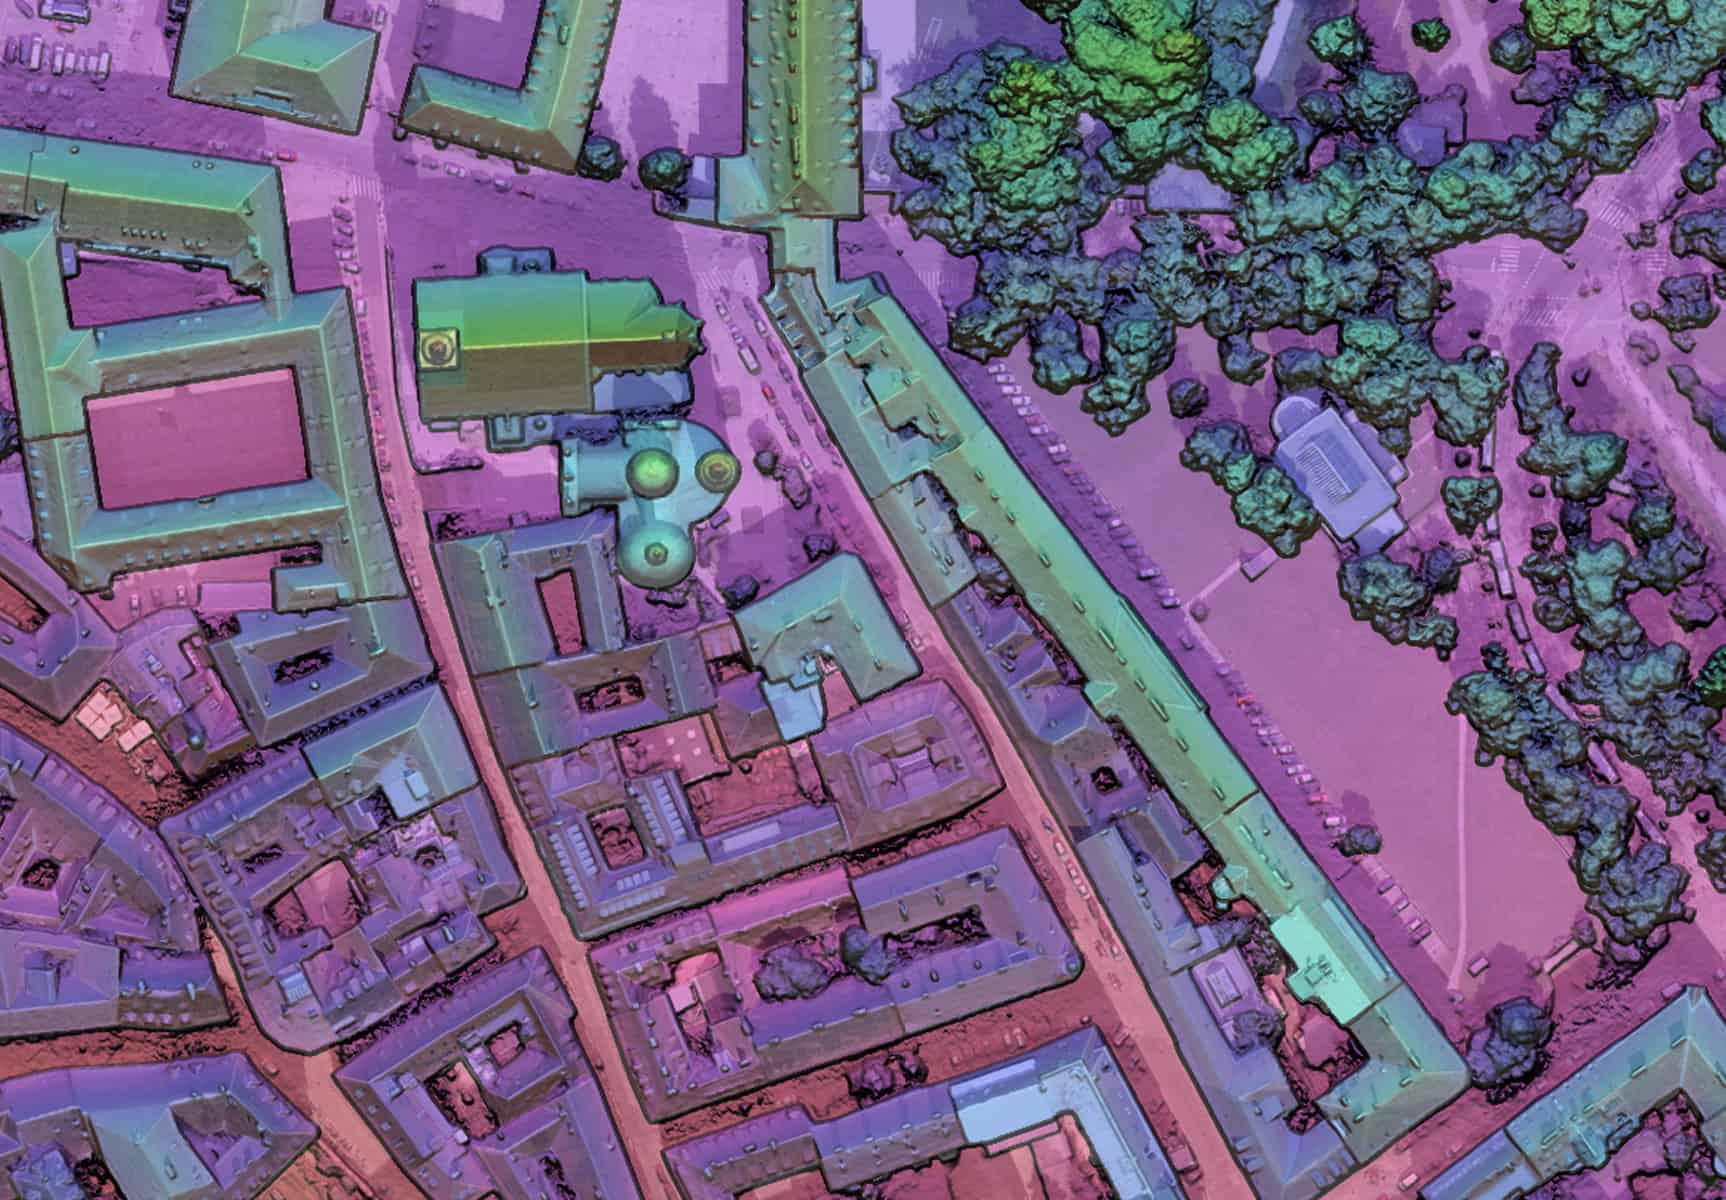
Image showing CATALYST Photogrammetry results

Overview

Our image processing and analytical algorithms and environments have been helping professionals and researchers break new boundaries in remote sensing, and Earth observation sciences for decades, and is referenced in thousands of academic articles.

Object-based analysis

Classify, analyze, and compare discrete features extracted from your imagery using our powerful image segmentation, object-based classification, and time-series analysis capabilities accessible through our intuitive GUI and API.

FEATURE HIGHLIGHT: OBJECT ANALYST

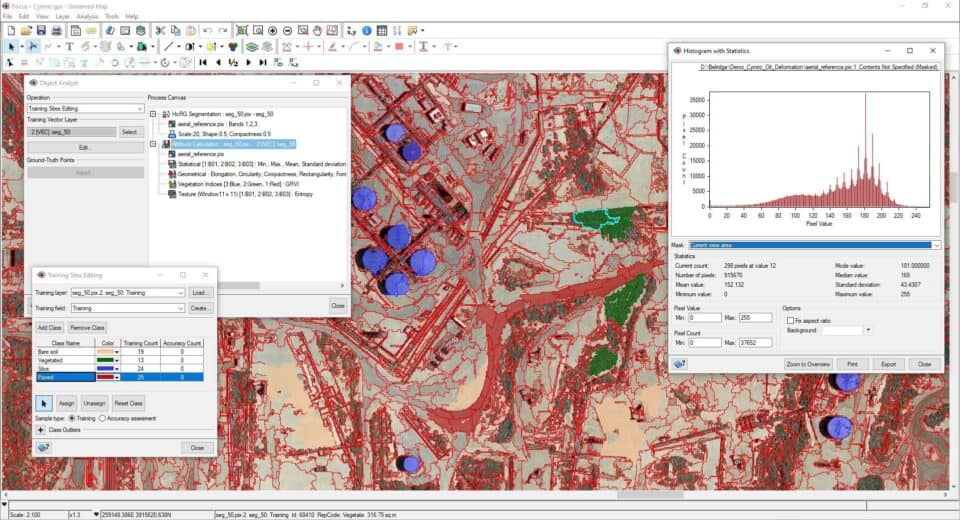
Object Analyst is an intuitive and interactive interface for segmenting and classifying objects from optical, and SAR image layers with machine learning.
Image of an OBIA Session

Image Classification

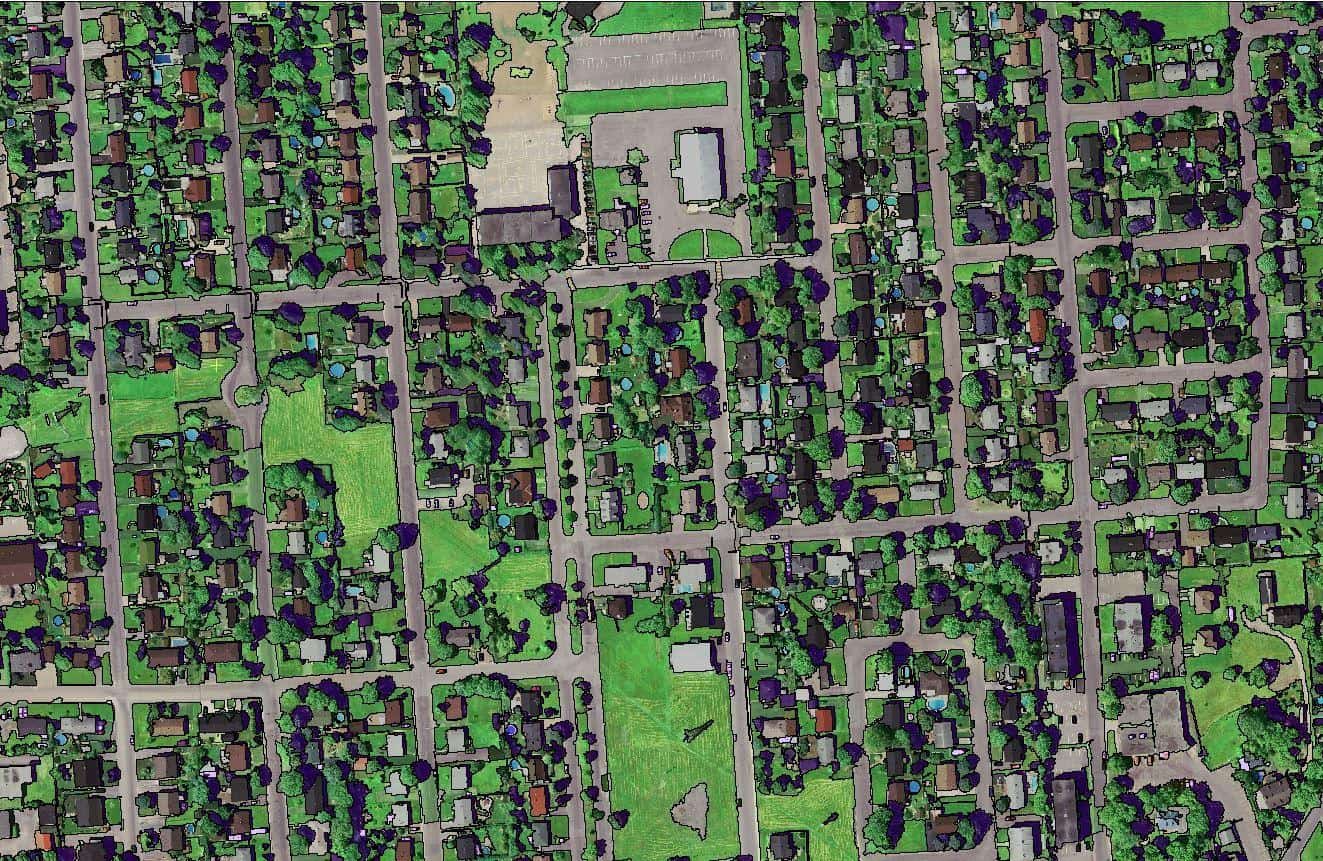
Our unsupervised and supervised image classifiers use the latest machine learning technology that are specifically tuned for earth observation optical and SAR imagery.

FEATURE HIGHLIGHT: RANDOM TREES (FOREST)

Widely considered one of the most robust and consistent machine learning classifiers available today. Random Trees (Forest) is less sensitive to outliers, often producing more reliable results.

Change Detection

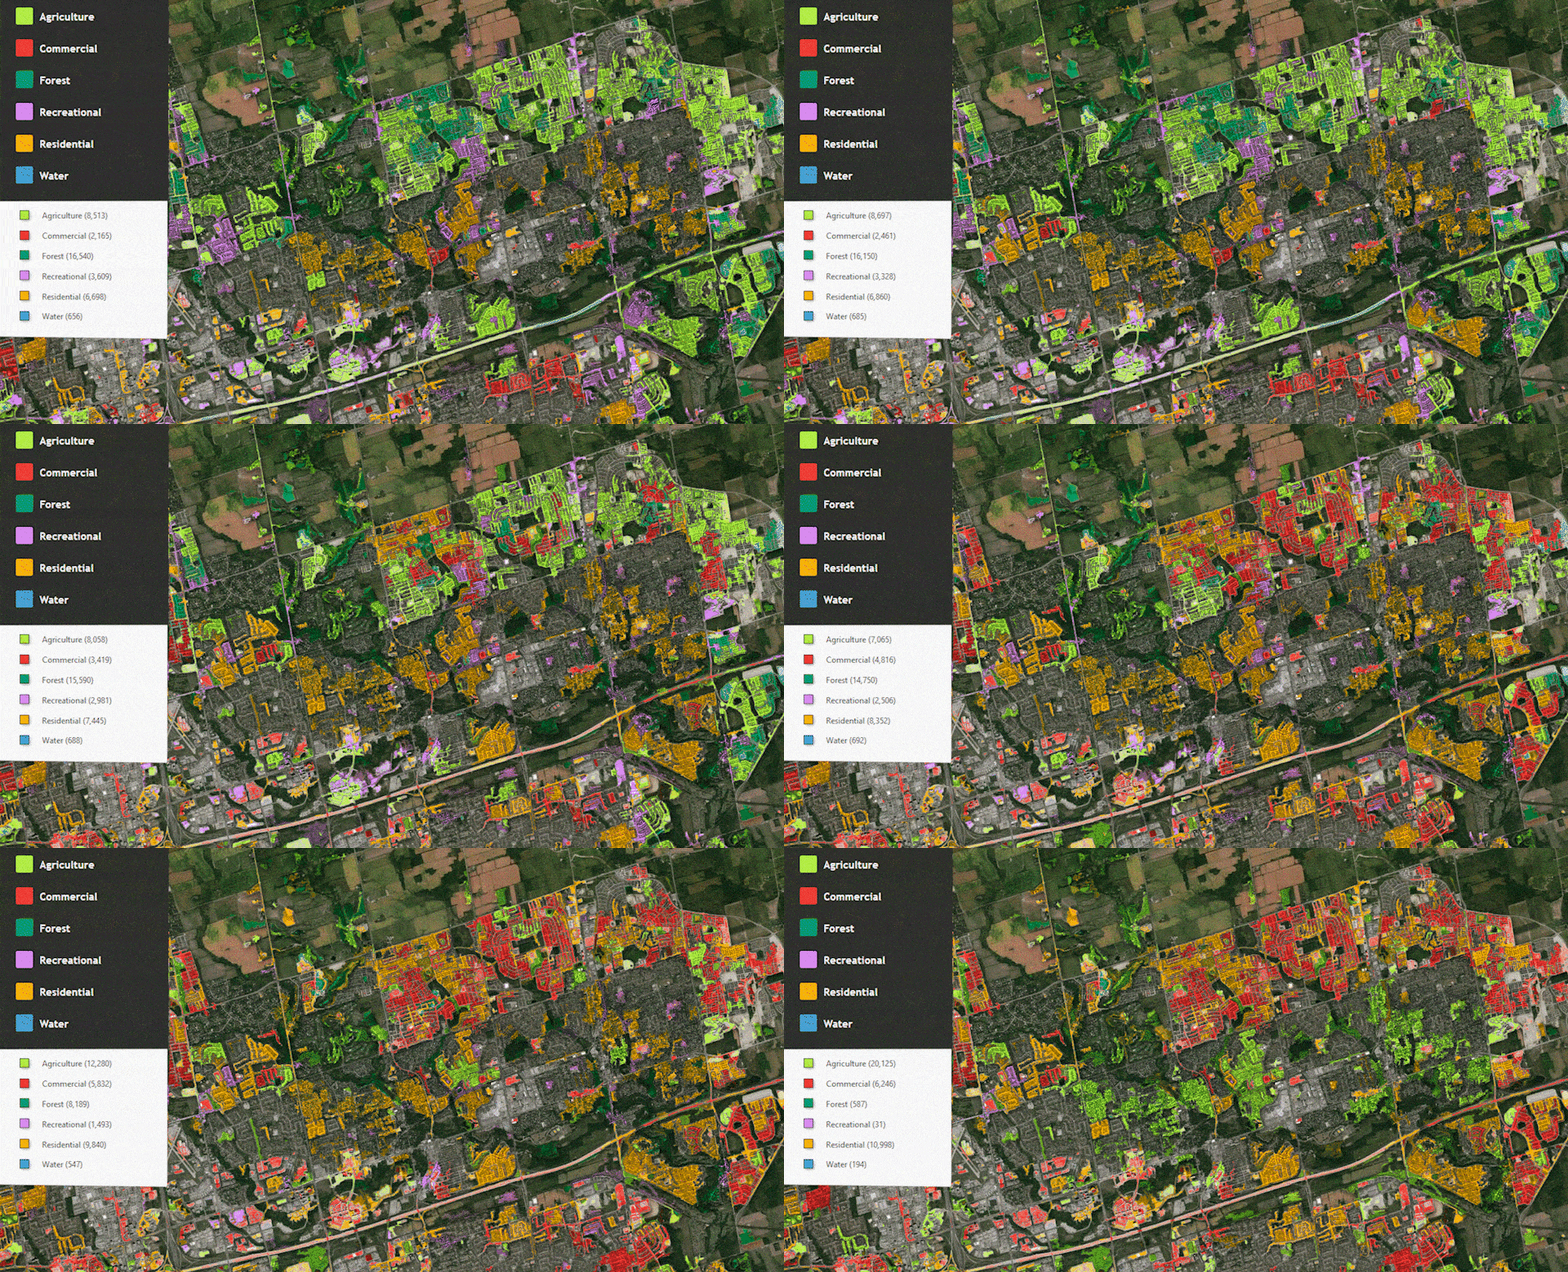
Detailed metadata at the image, band, and pixel level is stored within the CATALYST platform. Our spectral analysis tools give you the ability to assess vegetation health, mineral deposits, and the conditions of aging buildings and infrastructure.

FEATURE HIGHLIGHT: CHDETOP

Use over 27 different vegetation indices with VEGINDEX to measure vegetation density, general health, chlorophyll levels, and soil moisture.
Image showing 30 years of change of Toronto

Feature Extraction

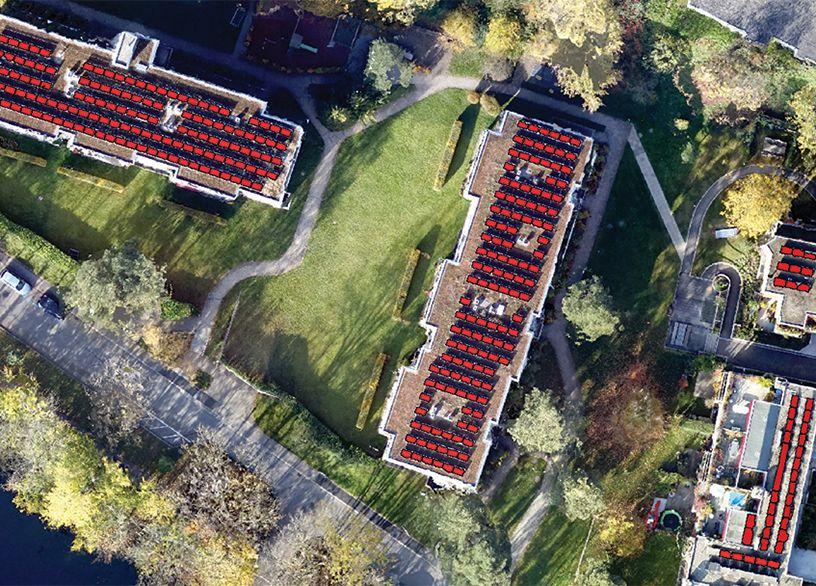
Extract important features from imagery, such as buildings, equipment, roads, fields, and lineaments

FEATURE HIGHLIGHT: LINEAMENT EXTRACTION

Our popular LINE algorithm is very effective at identify and extracting natural and unnatural linear features in imagery, and DEMs.
Image shwoing details of solar panels from space

Spectral Analysis

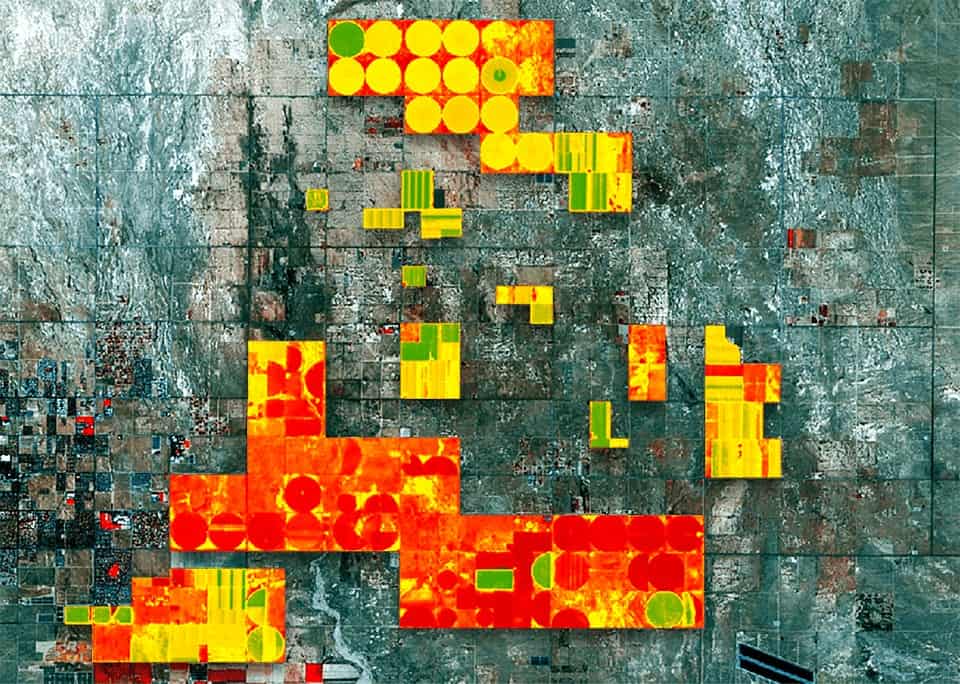
Metadata stored in data is captured on a per band and per pixel basis. Our spectral analysis tools give you the ability to assess vegetation health, mineral deposits, and the conditions of aging buildings and infrastructure.

FEATURE HIGHLIGHT: VEGINDEX

Use over 27 different vegetation indices with VEGINDEX to measure vegetation density, general health, chlorophyll levels, and soil moisture.
Image showing spectral analysis view
Image processing and data preparation
Data scientists and image analysts commonly report that about 80% of their time is spent preparing and preprocessing data for analysis. Our highly-automated image processing workflows reduce manual effort, time, and costs preparing data so more time can be spent on analytics.
Geometric Correction
Our orthorectification and image stack alignment capabilities are highly automated, scalable and have been tested to 1/10th of a pixel accuracy. This precision reduces false positives that skew analysis and can require costly manual intervention.

FEATURE HIGHLIGHT: SUPER REGISTRATION

Easily align any geocoded satellite, aerial and even UAV images together to 1/10th of an image accuracy. No math model or RPCs required!
Radiometric Correction
Our rich set of highly automated radiometric and terrain correction capabilities help compensate for impacts from things like the atmosphere, terrain illumination, viewing angle, and bi-directional reflectance.

FEATURE HIGHLIGHT: SPECLASS

This algorithm uses a rule-based method to pre-classify pixels from spectral and feature information to improve the quality of geometric correction, mosaicking, and analysis.
Data Engineering
Use your domain knowledge with our hundreds of algorithms to extract new data (features) from your original image bands to improve your analysis and machine learning classifiers

FEATURE HIGHLIGHT: PCA

Principal component analysis (PCA) reduces the number of dimensions in a dataset (layers) without compromising information, to improve classification results.
Image Fusion
Our pansharpening and image fusion algorithms are designed to deliver stunning high resolution images from multispectral and panchromatic pairs while maintaining the spectral integrity of your images.

FEATURE HIGHLIGHT: MULTI-RESOLUTION ANALYSIS (MRA) FUSION

MRA fusion creates a stunning pansharpened image, that preserves the spectral integrity of the image bands making it perfect for image compositing, spectral analysis and time-series analysis.
Seamless integrations with other packages
The CATALYST platform provides scalable earth observation image processing capability that can be seamlessly integrated with other leading machine learning, AI, GIS and visualization platforms to deliver a better overall experience.


GQIS Logo
Planet Logo
Sentinel Hub
USGS Logo
ARCGis Logo
Tensor Flow Logo
Cartovista
Cesium Logo
GBDX Logo

Get started today

Our competitive plans remove the traditional barriers of accessing professional software for processing and analyzing earth observation imagery and is trusted by thousands of geospatial professionals from around the world.
envelopephone-handsetcross