Tunnelling projects are among the most complex and challenging geoengineering endeavours, requiring a comprehensive understanding of risks including ground instability, active faulting, groundwater ingress, and settlement-induced damage. As a result, engineers rely on a wealth of informative, actionable, and real-time monitoring data to respond quickly to unexpected ground behaviour. Increasingly, engineers are turning to Interferometric Synthetic Aperture Radar (InSAR) as a remote, wide-area ground displacement monitoring tool capable of millimetric accuracy. InSAR data is used to inform and guide the deployment of ground-based instrumentation, ensuring that evolving displacement signals are well constrained and that redundant instrumentation is not placed on assets exhibiting continuous stability.
CATALYST has over 40 years of experience as leaders in the field of Earth Observation analytics, providing clients with InSAR data through a highly bespoke and established workflow, specifically designed to address the requirements of each project. This case study presents InSAR data derived during the tunnelling and construction of the Milan Metro Line 4.
Milan Metro Line 4 Construction
Milan’s M4 metro line represents one of Europe’s most ambitious urban tunnelling projects, linking Linate Airport to San Cristoforo across 15 km of fully underground railway through the heart of a densely populated and historic city. Constructed between 2014 and 2024, the line was excavated in three sections. The central section launched tunnelling westward from Tricolore station in early 2019, boring beneath some of Milan’s most treasured landmarks before breaking through near the Coni Zugna station on 9 September 2020.
Throughout the construction programme, rigorous real-time monitoring of Tunnel Boring Machine (TBM) performance and structural response was essential. A total of 631 buildings were tracked continuously and novel ground treatment techniques, including the use of liquid nitrogen to freeze and stabilise soils, were employed to mitigate ground movement risks.
CATALYST processed a single line-of-sight, three-year archive of Sentinel-1 radar data spanning January 2019 to December 2021, comprising 118 images, to calculate surface displacement across the greater Milan area. The resulting three-year cumulative displacement map is presented in Figure 1. Displacement values are one-dimensional: negative values (shown in red) represent movement away from the satellite, whilst positive values (shown in blue) represent movement towards the satellite. Derivation of pure vertical and horizontal displacement components is possible, enabling direct comparison with ground-based instrumentation, though this was not required for the purposes of this study.
Across most of the Milan region, displacement values fall within the measurement uncertainty of ±2 mm, shown as green in Figure 1. However, a striking pattern of negative displacement, reaching up to −15 mm, is clearly visible across the city centre, directly tracking the route of the new M4 metro line.
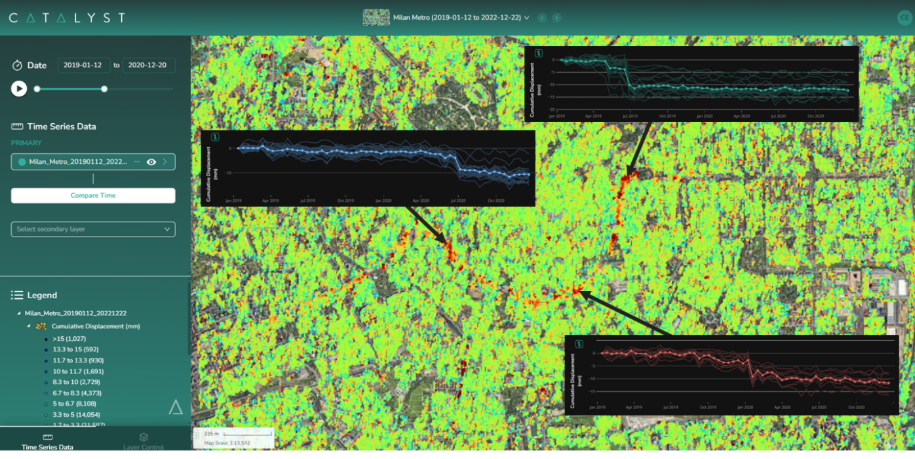
Figure 1 -InSAR displacement data over the Milan Area. Cumulative displacement map is scaled to ±15 mm. Time-series plots for several sample areas are inset.
Time-Series Analysis
CATALYST delivers InSAR and other Earth Observation products through its INSIGHTS platform. The platform provides a suite of tools specifically designed for the analysis and interrogation of InSAR data in addition to established GIS functionalities (e.g. basemaps, layer selection, colour map editing).
Time-series plots are provided for several sample points along the M4 corridor in Figure 1. These reveal that displacement at each location did not accumulate continuously or uniformly but occurred in discrete steps over very short periods - typically days to weeks. Furthermore, a clear temporal lag exists between displacement events at successive points along the line.
This behaviour is consistent with displacement being triggered by the passage of the TBM beneath the surface. The spatially variable timing of displacement events directly tracks the machine’s progress along the tunnel alignment. This is illustrated in Figure 2, which presents a moving six-month window of displacement activity, following the TBM as it advances in a westward direction. Despite being derived as a wholly independent dataset, the InSAR interpretation is entirely consistent with the known TBM trajectory which commenced at Tricolore station in early 2019 and completed near Coni Zugna station in September 2020.
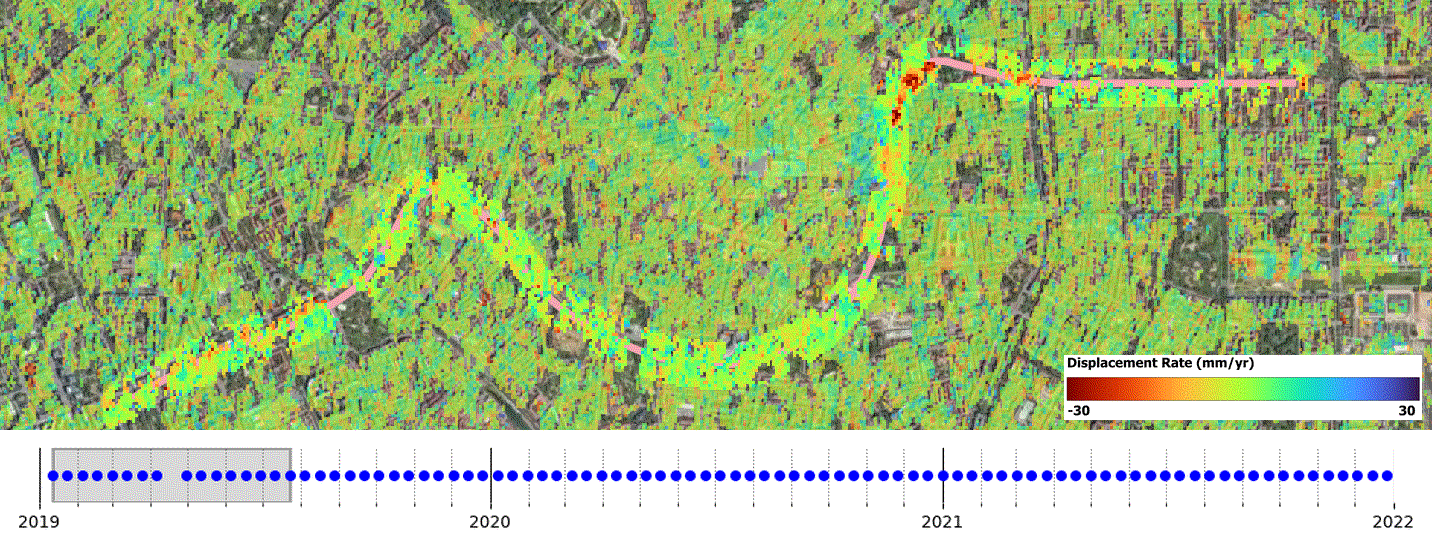
Figure 2 - A GIF tracking displacement signals as a function of time. Blue dots = acquired radar scenes and grey bar = moving 6 month window in which displacement measurements were calculated.
Conclusion
This case study demonstrates the millimetric accuracy achievable with InSAR and its ability to continuously monitor wide areas. The time-series analysis goes further to show that InSAR can independently track TBM-induced ground movement as it develops, resolving both magnitude and spatial extent with enough fidelity to reconstruct the machine's advance without any ground-based input.
For major tunnelling projects, InSAR serves a dual function: establishing historical displacement baselines from archive data and providing ongoing operational monitoring throughout construction. CATALYST’s suite of solutions, supported by flexible reporting, ensure decision-makers receive outputs tailored to their specific challenges and requirements.
Watch the full webinar recording to learn more about the project, outcomes, and implementation details.