After you thoroughly checked the exterior orientation (EO) provided with the data sets of the prospective customer, and you are comfortable with describing the units and the projection, your next check is to plot the x and y position of the EO by using CATALYST Professional Focus.
To plot the position of the EO
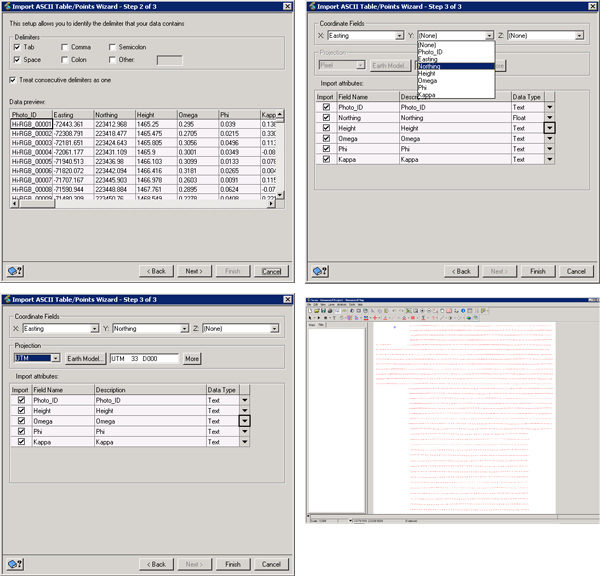
- In Focus, click the File menu, point to Utility, and then click Import ASCII Table/Points.
-
Open the EO text file.
With the Import ASCII Table/Points wizard, you can import data similar to using a spreadsheet program, such as Microsoft Excel. For more information on using the wizard, search Using the Import ASCII Table/Points wizard in the Focus Help.
- Choose the proper X Y columns in your data and set them to "Real" numbers and as X and Y in the columns.
-
Set the projection information.
You can query points in the layout to find four images that are in a small block.
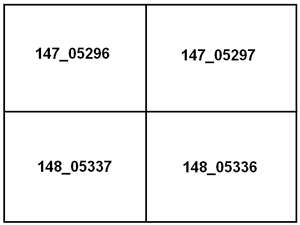
By following the steps in this topic, you have established the layout of the area that was surveyed, and identified a subset of images (a two-by-two block) that you will use for further testing and data preparation.