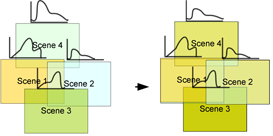
Radiometric differences among images can cause a patchwork effect in a mosaic. Color balancing evens out the color contrasts from one image to another to reduce the visibility of the seams and produce a mosaic that is appealing visually.
None does not apply any color balancing to your images.
Bundle color balancing is recommended for most image mosaics. It uses two main steps to balance the overall mosaic.
The first step computes the statistics for all overlapping image areas after automatically removing anomalies in the data, such as clouds, snow, and so forth. A bundle color adjustment is then applied globally to minimize the overall differences between all overlapping areas. This adjusts both the mean and sigma (brightness and contrast). Subsequently, small differences in overlapping areas that were not removed will remain; however, there will be fewer than there were originally.
In the second step, the remaining differences are modeled with dodging. Dodging adjusts pixel values to try to minimize differences between images. There are two possible types of dodging:
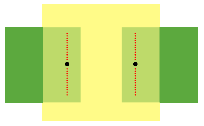
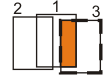
- Edge: creates a dodging point between two overlapping images, resulting in a fairly uniform distribution of points. Each point represents a dodging line. Modifying the dodging point essentially changes the dodging line drawn between these two images. This method is used primarily for satellite imagery or airphotos that have few overlapping images.
Figure 2. Edge dodging
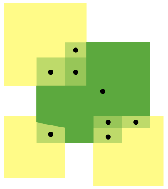
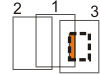
- Floating: creates a dodging point between each overlapping image, resulting in many points scattered over the mosaic. This method is used primarily for airphoto imagery with large numbers of overlapping images.
Figure 3. Floating dodging
The Bundle technique ignores the order of the input images, because all of the overlapping images are used to adjust one image.
Histogram builds histograms for each image starting from the center of the mosaic, determines the optimum radiometry for the input image from the data in the mosaic file, and then applies the transformation to the entire input image as it is added to the mosaic. This is controlled by a match-area percentage, which determines the amount of data in the mosaic file that is used to calculate the color-balancing histogram. The size of the input image and the match-area percentage are the factors that determine the size of the corresponding area. The valid data in the mosaic file within the boundaries of the match area are combined with the input image data to calculate the color-balancing histogram.
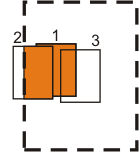
For example, in the following table, image 3 is being added to the mosaic file that contains image 1 and image 2 (the rest of the mosaic file is empty). The area used to match the histograms is represented by a dashed-line rectangle.
| To create a corresponding area | Enter a match-area percentage of | Result |
|---|---|---|
| Three times the size of the input image | 300 | The highlighted areas in images 1 and 2 and all the pixel values in image 3 are used to calculate the histogram.
|
| The same size as the input image | 100 | The highlighted area in image 1 and all the pixel values in image 3 are used to calculate the histogram.
|
| Half the size of the input image (1) | 50 | The highlighted area in image 1 and all the pixel values in image 3 are used to calculate the histogram.
|
| Half the size of the input image (2) | -50 | Only the pixel values in the highlighted area of both image 1 and image 3 are used to calculate the histogram.
|
Tail trim
Images can contain pixel values that fall outside of most of the others in the range. These values, known as outliers, can skew the histogram, which can reduce the effectiveness of the color balancing. The Tail trim enhancement feature removes the the upper and lower percent of the range, thereby eliminating the outliers.
By default, Tail trim uses a two-percent margin, but you can adjust the amount of trim ranging from one through five percent.
Overlap Area computes the color-balancing histogram using only the pixels in the overlapping area of the images being added to the mosaic file.
The Reference image color-balancing method uses gain-and-bias offset to modify the input scene histograms; it is less aggressive than the Histogram color-balancing method. It results in good matching of images, with fewer outliers or artifacts than Histogram when the data is dissimilar. The variance in images is greater than the Histogram method, but likely with fewer artifacts.
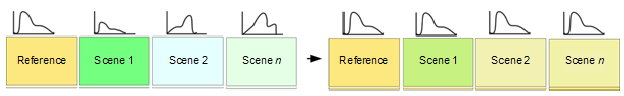
The color balancing is based on matching the source-image histogram with that of the specified reference image.
The Neighborhood color-balancing method is more intense computationally than other methods. It uses all surrounding images to modify the gain and bias of the histograms, regardless of their z-order (based on sorting order) and works iteratively to modify neighboring pixels. Because of this iterative method, sharp variations in color are reduced and trends in color balancing will be stretched over multiple scenes.
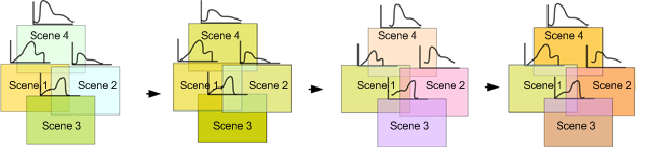
The Neighborhood method is best suited to large-area mosaics, in which features tend to change from one end of the mosaic to the other.