A graphical element representing a module consists of an icon, the module name, the status indicator bar, and one or more port glyphs.
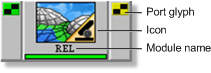
Icons
The term icon refers to the graphic located at the center of a module graphical element and identifies the function of a module.

Glyphs
Glyphs are graphical representations of data ports. Ports are the data input and output points of a module.

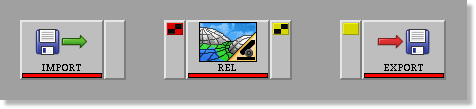
Most modules have at least one data input and one data output port. Some modules, however, have only input or output ports; for example, the Import module has only output ports, while the Export module has only input ports. A few modules have neither input nor output ports, such as the IHR module, which reads a database image header.
An input glyph represents an input port where data is stored prior to being processed by the module. Pointing the cursor at the glyph displays an arrow showing the direction of data flow.
An output glyph represents an output port where processed data is stored. Pointing to the glyph displays an arrow showing the direction of data flow. One output port can be connected to multiple input ports.
The connection characteristics of a port are indicated by the color of its glyph, as shown in Table 1.
| Glyph | Color | Description |
|---|---|---|

|
Red | Mandatory connection |

|
Red (dimmed) | Unavailable, no connection possible |

|
Green | Connected |

|
Green (dimmed) | Unavailable, no connection possible |

|
Yellow | Optional connection |

|
Yellow (dimmed) | Unavailable, no connection possible |
A port can be "thin" or "fat". A thin port accepts a single layer or segment. A fat port, which is slightly larger than a thin port, accepts multiple layers or segments.
Each type of data has a corresponding port, and hence a corresponding glyph. Some modules can accept more than one type of data and, therefore, can display more than one type of glyph. The most common glyph types are shown in Table 2.

|
Raster Layer |

|
Signature Layer |

|
Lookup Table (LUT) |

|
Pseudocolor Table |

|
Bitmap Layer |

|
Ground Control Points Layer |

|
Vector Layer |

|
Any Port: accepts all layer types |

|
Text |

|
Signatures |

|
Mixed Layers |

|
Math Model |
When you point to a glyph, the port type displays in the status area of the Modeler window. For information about the Modeler window, see Understanding the Modeler window.
When you click the output glyph of a module, ports on modules that cannot accept data from that module appear dimmed. Ports that can accept data do not change.
Any and Mixed ports
Ports of the Any type can accept all layer types shown in Table 2. Although you can feed more than one layer into an Any port, you cannot feed concurrently in layers of different types. For example, an Any port can accept two raster layers, but not a combination of one raster layer and one vector layer. When you connect an Any port, its glyph changes to reflect the type of layer the port contains.
A Mixed port can accept more than one type of layer and more than one layer of each type. For example, you can feed two raster layers and two vector layers into a Mixed port. When you connect a Mixed port, its glyph does not change.
Master ports
The master port is the first input port on most modules. Master ports are not distinguished graphically from other port types.
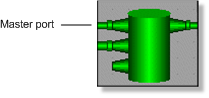
A master port defines the resolution, the bounds, and the georeferencing for all layers feeding into any other port on the module. If a layer with a resolution or extent different from that defined by the master port is fed into a nonmaster port, the layer may be resampled, cropped, or extended to conform with the settings of the master port. Generally, you must have data in the master port of a module for a model to run.
Status-indicator bar
The color of a module's status-indicator bar indicates the processing mode, as described in Table 3.
| Status-indicator bar | Color | Description |
|---|---|---|

|
Red | Module is not connected or is configured improperly and cannot be run |

|
Green | Module is configured properly and is ready to be run |

|
Blue | Module is processing |

|
Gray | Processing is complete and data is stored in the cache |

|
Yellow | A warning message has been logged |
Deactivated module
If you run a module that is not configured correctly, it displays as deactivated, as shown in Figure 5. For information on activating a module, see Activating a deactivated module.

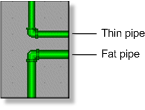
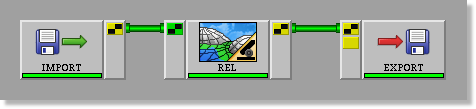
Pipes
Pipes are graphical elements that represent paths of data transmission between modules. A pipe can be "thin" or "fat". A thin pipe contains only one layer of information. A fat pipe, which is wider than a thin pipe, contains multiple layers of information.
Thin pipes connect to thin ports only, and fat pipes connect to fat ports only. However, there is an exception to this rule. If you connect a module with a single output layer to a second module, a thin pipe will connect the modules. If you then increase the number of output layers, a fat pipe will connect the modules. However, the thin input port will not change to a fat input port. If you run the model, the second module deactivates.
You connect modules by clicking the output port of the module you want to connect from and then clicking the input port of the module you want to connect to.
You can also connect between a pipe and a module by first clicking the pipe, and then clicking the input port on the connecting module.
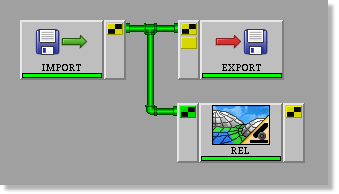
With this type of connection, the same data is sent to both modules. The connection does not split the data. For information on splitting data, see Placing the Split module on the canvas.
Pipe types
A pipe is default color-coded according to the type of data that it transmits:
- Green: Raster data
- White: Vector data
- Red: Bitmap data
- Blue: Pseudocolor table
- Yellow: Lookup table
- Black: Dead pipe
For information on customizing pipe color, see Connecting modules with a pipe.
Caches
After a model has executed without errors, bulges (called caches) containing intermediate files form. To save a file stored in a cache, you must attach an Export module to the pipe containing the cache. For information on the Export module, see Placing the Export module on the canvas.
For information on viewing cache content, see Viewing pipe content.