The first step in performing quality assurance (QA) on the output of the Data Ingest and GCP Collection module is to scan the GCP Residuals Summary report for anomalies: images that contain particularly high residuals or a small number of collected GCPs.
To review the collected GCPs
-
In the output folder of the module, open the GCPResidualsSummary.txt file.
In Figure 1, the report shows several ingested images that have a low number of collected GCPs, and a very high check-point residual. Although there may be several reasons for this, such as a heavy presence of clouds in the imagery combined with insufficient chip coverage for the region, the affected images merit closer inspection.
Figure 1. GCP Residuals Summary report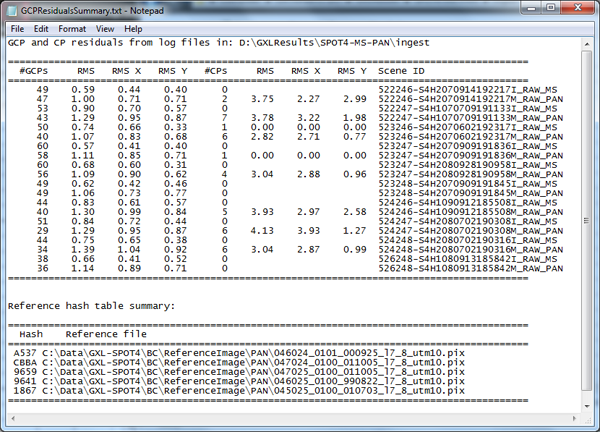
-
Open the OrthoEngine project file for one of the questionable images.
For example, for image 522247-S4H1070709191133M_RAW_PAN.pix shown in Figure 1, open the CATALYST Professional OrthoEngine project file:
522247-S4H1070709191133M_RAW_PAN_OE.prj
-
In OrthoEngine, review the GCPs collected for this image.
Compare each GCP with its corresponding point (either in a chip database, reference image, or other). The GCPs should align well with the reference source.
For example, Figure 2 shows the GCP Collection window for the sample image 52693431001240357022J_RAW_MS.pix, indicating that the image contains two collected GCPs.
Figure 2. GCP Collection window for 52693431001240357022J_RAW_MS.pix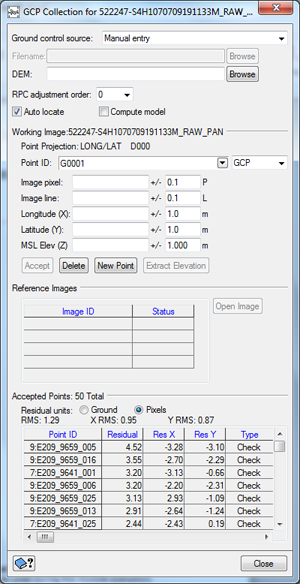
- To verify these GCPs, in the Ground Control Source list, select the source from which the GCPs originated (reference image, chip database, other), and then enter the path and file name of the data source.
-
Compare the position of the GCP in the raw data set with its position in the selected reference data set.
For example, point E209_9659_005 is shown in Figure 3.
Figure 3. Comparison of GCP in image and Chip Database for point E209_9659_005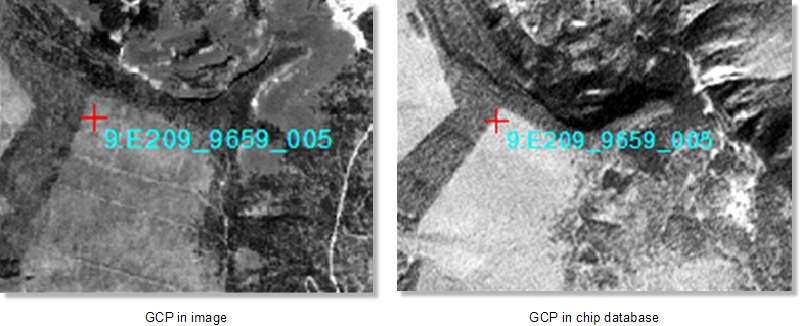
- Repeat this procedure for each problematic image.