The first step in performing QA on the output of the Tie-Point Collection and Refinement module is to view the project Residual Errors report to identify problem areas, and examine the tie points (TP) collected during processing.
To review the TPs collected
-
In CATALYST Professional OrthoEngine, open the project file with the collected TPs, final_refined.prj.
This file contains links to images in the project, all refined GCPs (collected previously), and collected TPs.
-
In the Processing step list, select Reports, and then click Residual report.
The Residual Errors window appears, displaying the Residual Report for the project, as shown in Figure 1.
Figure 1. Residual Errors window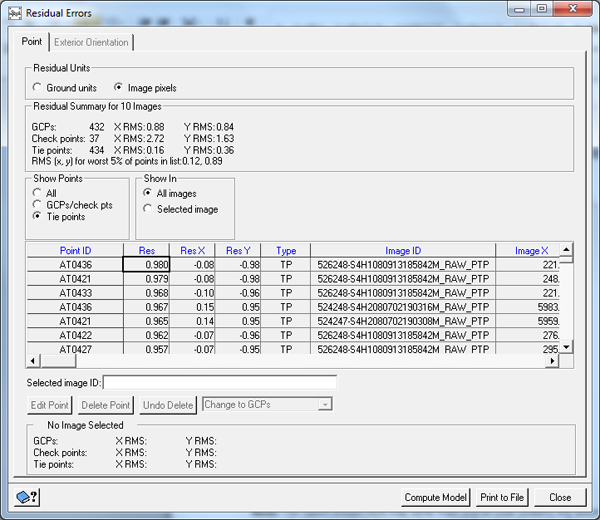 Note: The report shown herein may differ from the one that you see. This is because the automated TP-collection procedure does not always yield the same TPs each time the module is run.
The Residual Errors report provides a summary of the residuals for the entire project. In Figure 1, the report shows that the project contains 432 GCPs with an RMS of 0.88 pixels in x and 0.84 pixels in y. The project also contains 434 TPs with an RMS of 0.16 pixels in x and 0.36 pixels in y.
-
To update the table to display the TPs and their associated residuals, under Show Points, click Tie Points.
Review the table entries to identify TPs with the highest residuals and note the image file with which each is associated.
In Figure 2, tie point AT0436 has an RMS of 0.980 pixels, and is found in image 526248-S4H1080913185842M_RAW_PAN.pix:
Figure 2. RMS of tie point AT0436 in image 526248-S4H1080913185842M_RAW_PAN.pix
- In the table, double-click the TP with the high residual to open the image in the viewer.
- Close the Residual Errors window.
-
In OrthoEngine, in the Processing step list, select GCP/TP Collection, and then click Manually collect tie points.
In Figure 3, the Tie Point Collection window shows all of the TPs for the selected image. When you click a TP in the table under Accepted Tie Points, it updates the Reference Image Tie Points and Candidates table with the image or images in which the TP appears.
Figure 3. Tie Point Collection window showing TPs in the selected image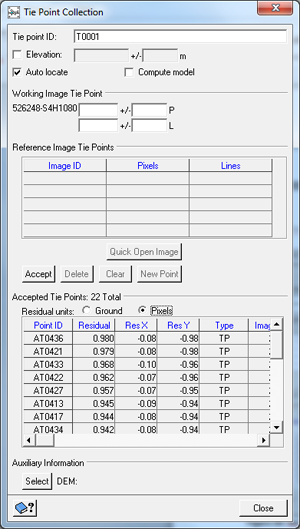
-
In the table under Accepted Tie Points, click the high-residual TP you identified previously.
In Figure 4, the Reference Image Tie Points table in the Tie Point Collection window shows the images in which the selected TP appears, and in the viewer, the image open currently also centers on the selected TP.
Figure 4. Reference Image Tie Points table in Tie Point Collection window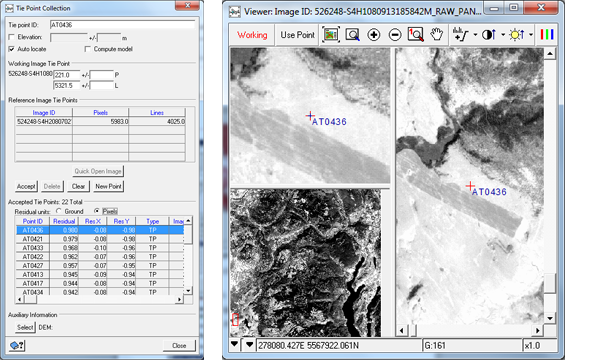
-
In the Reference Image Tie Points and Candidates table, click the image containing the high-residual TP, and then click Open Image.
The image that also contains the high-residual TP also opens in another viewer window.
-
In the Tie Point Collection window, in the Accepted Tie Points table, click the high-residual TP again in the Point ID column.
In Figure 5, the viewer shows the high-residual TP, centered.
Figure 5. Viewer, centered on high-residual tie point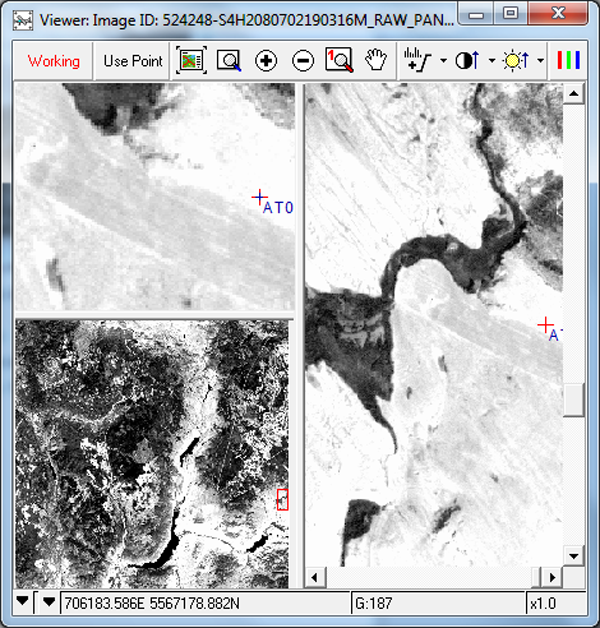
-
Compare the position of the high-residual TP between the two locations.
The points should align relatively well. If necessary, reposition or remove the point.
-
Repeat this procedure for various TPs among the various images.
Evaluate the quality of various TPs in other images to determine if the points should be modified or removed.