You can analyze interferometric stacks produced with INSSTACK by viewing an interactive InSAR temporal chart.
In the graph in Figure 1, the y-value corresponds to the parameter selected in INSSTACK and the x-value corresponds to time, as derived from the metadata of the file INSSTACK creates. The y-value can be any of the following:
- Phase (in radians)
- Ground velocity
- Cumulative ground displacement
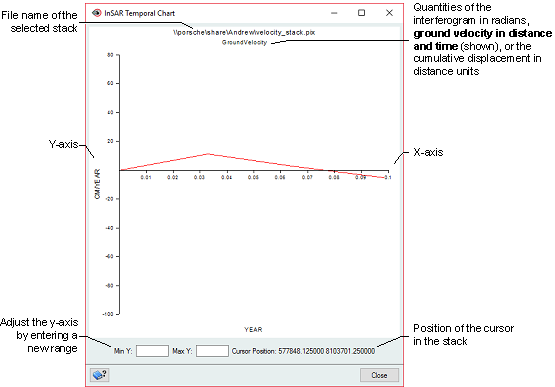
Figure 1. Viewing an interactive InSAR temporal chart
The metadata from which the chart is produced includes the following:
- Start time of the stack
- Temporal midpoints
- Distance units (DUNITS)
- Temporal units (TUNITS)
You can also open any ancillary image files to use for spatial context.
To view an InSAR temporal chart
- Open the file you created with INSSTACK.
-
On the Maps tab, select the stack file, and then on the Analysis menu, click InSAR Temporal Chart.
The InSAR Temporal Chart window appears.
You can do one or both of the following, as necessary:
- To adjust the range of the y-axis, enter the values you want in the Min Y and Max Y boxes, respectively.
- To update the quantity, click a new location in the stack.
Notice that as you click each new location, the graph is updated automatically with the new quantity.
Tip: You can open more than one stack at a time and view the temporal chart for each. That is, you can open several instances of the InSAR Temporal Chart window.