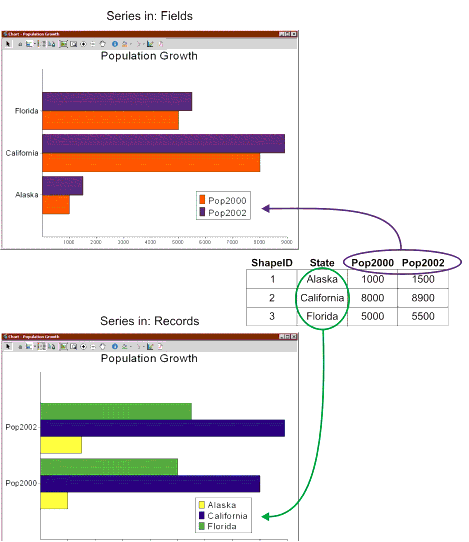
The Series In option on the Chart Definitions window defines what is displayed in the graph. Depending on what you want the data to be interpreted, you may want to emphasize either the records or the fields. When you select Records, the data in each record is represented in the chart. When you select Fields, the data is displayed by field in the chart.
For example, when you choose Fields for the chart shown in the following figure, the fields are displayed as bars (Pop2000 and Pop2002). When you choose Records, the records (Alaska, California, and Florida) are displayed as bars.